

The Neck Up Alignment Index.
Your Most Dangerous Risk Isn't on the Balance Sheet.
It’s the invisible gap between how your Board and your Executive Team see risk, strategy, and culture
The Neck Up Alignment Index™ measures live organizational tension, giving CEOs and Board Chairs a data-driven look at hidden operational friction before it turns into a regulatory surprise during your upcoming safety and soundness exam.
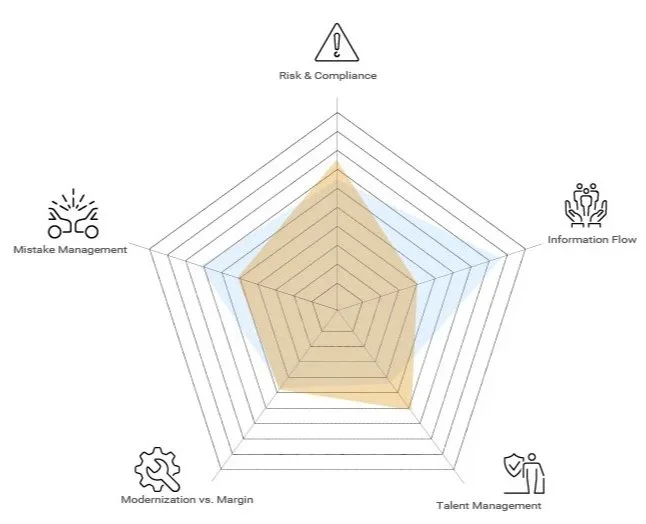
Alignment Index Results
Neck Up Alignment Index · Confidential · Board & Executive Team
This report measures how well your board and executive team are aligned across five governance tensions that predict cultural risk in community banks. Each row shows where the two groups stand — and more importantly, where they diverge without knowing it. Three numbers drive every row. Here is what each one tells you.
| Governance Tension | Board Average Mean (x̄) · where the group collectively lands on 0–100 | Executive Team Average Mean (x̄) · where the group collectively lands on 0–100 | Cross-Team Gap Delta (Δ) · distance between the two group averages | Diagnostic Finding What this pattern means for your governance risk |
|---|---|---|---|---|
| 1. Risk & Compliance Policy vs. Relationship |
24
High Agreement σ = 8
Low dispersion (σ = 8): board members answered very similarly — this is a unified group position, not an average of divided opinions.
|
76
High Agreement σ = 6
Low dispersion (σ = 6): executive team members also answered very similarly — this too is a unified position.
|
52 ⚠ Critical Gap | Opposing Fronts Both teams are internally unified — but on opposite poles of the same question. Management pushes relationship-based flexibility; the Board expects strict policy limits. Neither group knows the other has already decided. |
| 2. Information Flow Internal Win vs. Report |
82
High Agreement σ = 11
Low dispersion (σ = 11): the board is strongly aligned in expecting full operational transparency — this is a firm, shared expectation.
|
35
High Agreement σ = 14
Low dispersion (σ = 14): the executive team is also internally consistent — they collectively experience friction escalating bad news upward.
|
47 ⚠ Critical Gap | The Filter Problem The Board assumes absolute transparency. The executive team experiences real friction escalating bad news. The board is not receiving the picture it believes it is receiving. |
| 3. Talent & Toxic Culture Culture vs. Production |
52
Divided σ = 32
High dispersion (σ = 32): board members gave widely varying answers. There is no unified board position on this issue — individual directors hold opposite views.
|
78
High Agreement σ = 9
Low dispersion (σ = 9): the executive team is aligned on this — they lean consistently toward protecting production over cultural accountability.
|
26 ↑ Action Required | Consensus Fracture The gap between groups is moderate — but the more urgent risk is inside the board itself. Board members are deeply divided on how to handle high-producing toxic subcultures. The executive team has already picked a side. |
| 4. Modernization vs. Margin Future-Proof vs. Earnings |
45
Expected Variance σ = 18
Moderate dispersion (σ = 18): some variation in board views, which is normal for a strategic trade-off question. Not a signal of division — a signal of healthy deliberation.
|
48
High Agreement σ = 15
Low-to-moderate dispersion (σ = 15): executive team is largely aligned on the pace of modernization investment.
|
3 ✓ High Alignment | Strategic Win A Delta of 3 is effectively zero — both groups are at the midpoint and closely aligned. This is the rarest finding in the index: genuine cross-team consensus on a difficult strategic trade-off. |
| 5. Mistake Management Grace vs. Consequence |
68
High Agreement σ = 12
Low dispersion (σ = 12): the board is unified in expecting proactive self-reporting of operational problems before they escalate.
|
22
High Agreement σ = 10
Low dispersion (σ = 10): the executive team is also unified — they consistently tend to manage backlogs informally rather than escalating them.
|
46 ⚠ Critical Gap | The Blind Spot The Board expects proactive self-reporting. The executive team handles operational backlogs quietly and informally. Each group believes they are operating within understood norms. They are not. |
How the Alignment Index Works: The Mechanics
The Neck Up Alignment Index™ is built to be fast, entirely stress-free, and legally defensible for community bank leadership teams. Here is exactly how the process works from start to finish:
100% Anonymous: Participants complete the digital assessment independently. Responses are tagged strictly by cohort (Board of Directors vs. Executive Leadership Team)—never by individual names.
Strictly Aggregated: Individual data points are immediately hidden and combined. The final dashboard only displays group averages (means) and team consensus metrics (standard deviations), protecting everyone in the room.
Anonymized Benchmarking: Your bank’s data is securely logged into a running, blind dataset categorized by region and asset size. This allows you to benchmark your leadership’s alignment against national community banking percentiles.
The Architecture: 5 Vectors & 15 Questions
The entire diagnostic consists of just 15 questions. Instead of standard "agree or disagree" check-boxes, participants use an interactive 0–100 slider to rate realistic, high-tension scenarios. This forces leaders to make tough operational trade-offs rather than choosing safe, middle-of-the-road answers.
The 15 questions are evenly split across five core cultural vectors, with each vector containing a Situation Check, an Escalation Check, and a Historical Pattern Check:
1. Risk & Compliance: Measures whether the challenge function is active, or if the bank is deferring to a dominant growth strategy that risks dangerous loan concentrations.
2. Information Flow: Evaluates the actual velocity of communication—specifically how fast and transparently bad news or unusual activity travels to the board.
3. Talent & Toxic Subcultures: Tests the bank's tolerance thresholds for high-producing employees who bring in revenue but actively bypass internal controls or classification standards.
4. Modernization vs. Margin: Examines strategic friction surrounding technology, looking at whether fintech or digital expansions are outpacing the bank's risk infrastructure.
5. Mistake Management: Identifies whether internal operational backlogs are surfaced early as resource allocation needs, or hidden away out of fear of performance consequences.
Measuring Your Five Core Cultural Tensions
Risk & Compliance
MEASURES: Strict Policy vs. Protect Relationship
Information Flow
MEASURES: Internal Win vs. Immediate Report
Talent & Toxic Subcultures
MEASURES: Protect Culture vs. Protect Production
Modernization vs. Margin
MEASURES: Future-Proof vs. Protect Earnings
Mistake Management
MEASURES: Grace/Coaching vs. Strict Consequence
Book a 15 minute discovery call with the NeckUp Team



Contact Us
Interested in working together? Fill out some info and we will be in touch shortly. We can’t wait to hear from you!